SaaS · Data visualization
Professional workTactiSport
Making football data readable on the pitch.
A football analytics portal that helps coaches and analysts explore tactical reports, movement, and pressure.
- 12+ interactive reports
- 5 user roles
- English / Arabic
The problem
A report needs a football context.
Coaches and analysts need to connect tactical data with what happens on a pitch. Formations, pressure, player positions, and movement relations describe different aspects of play. Presenting them as a long list of numbers would leave the reader to reconstruct the spatial relationships.
TactiSport brings those reports into a portal alongside booking and administration. The frontend has to serve people reviewing analysis as well as the operators and administrators managing the work. That means both the report experience and the surrounding navigation need to reflect the user’s task.
My responsibility
My part: the portal and its visual language.
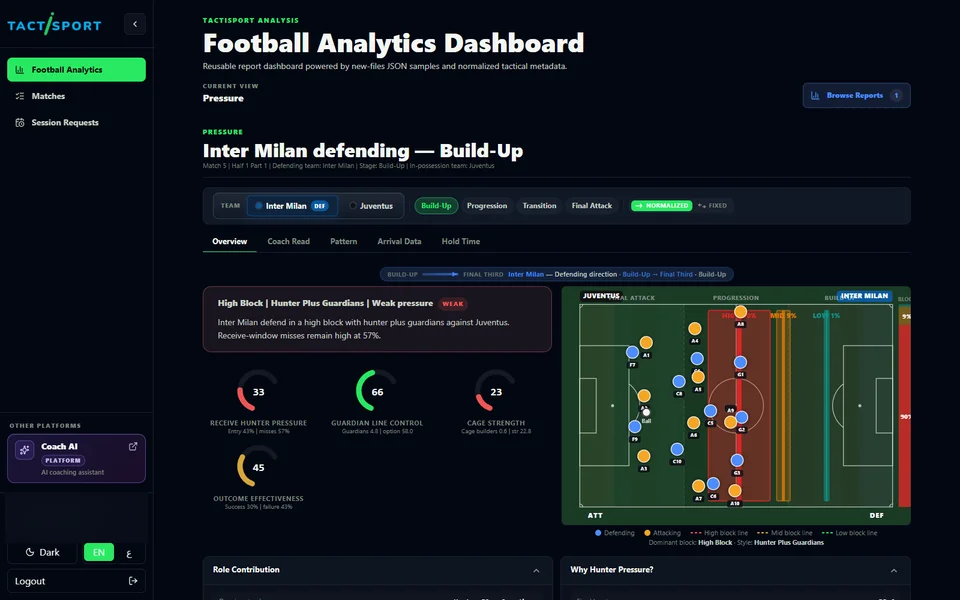
I built the portal frontend, including a tactical pitch renderer and more than twelve interactive reports. The renderer uses React layers for formations, heatmaps, positions, movement relationships, pressure, and zone flow. D3.js and Recharts support the visualization work.
My scope also included protected routes and reusable permission hooks for five roles, bulk ZIP report uploads through AWS S3 presigned URLs, session booking, and administration screens. The interfaces support English and Arabic, right-to-left layouts, and light and dark themes. This case study focuses on my frontend contribution rather than ownership of the analysis engine.
Implementation & tradeoffs
One pitch, different layers of information.
The implementation uses reusable pitch layers across report types. A common spatial surface gives formations, movement, and pressure a shared frame of reference. Each report can then expose the information relevant to its own question. The tradeoff is that a shared renderer needs clear boundaries between common geometry and report-specific presentation.
Permissions shape which navigation, screens, and actions the frontend presents. Those checks make the interface relevant to the current role; they are not a substitute for server-side authorization. The upload interface uses presigned URLs to send report files to S3, while authorization and URL issuance remain responsibilities of the backend.
A closer look
Walk through the work.
Real product screens, with context. No account needed.
Pitch positions, tactical zones, and pressure indicators sit alongside the report interpretation. The visual connects the numbers to a football situation.
Scope & limits
Concrete scope, visible evidence.
The delivered frontend includes 12+ interactive tactical reports, access-aware interfaces for five roles, and bilingual layouts. The walkthrough shows pressure, movement relations, and zone analysis without requiring a product account. Its captions explain what to look at rather than asking the screenshots to tell the entire story.
The displayed analysis values belong to the product’s report examples. They are not evidence of a performance improvement or commercial result attributable to me. This portfolio does not publish a measured before-and-after outcome for the work. The live platform may require authentication; the screenshots remain the public demonstration.
Let’s talk about your product
Open to opportunitiesComplex product?
Let’s make it clear.
I’m looking for frontend developer opportunities where I can contribute to a product and work closely with designers, engineers, and the people using it.
Based in Cairo. Open to roles in Egypt, international remote work from Egypt, and relocation with visa sponsorship.
asultan.dev@gmail.com